All posts by eas

DIY Programmable Lithium Ion Charger Shield

Update:  According to this comment on Dangerous Prototypes, the charger chip’s support for lithium ion charging is quite primitive, and so this project depends on the Arduino to properly manage the charging. Too bad.

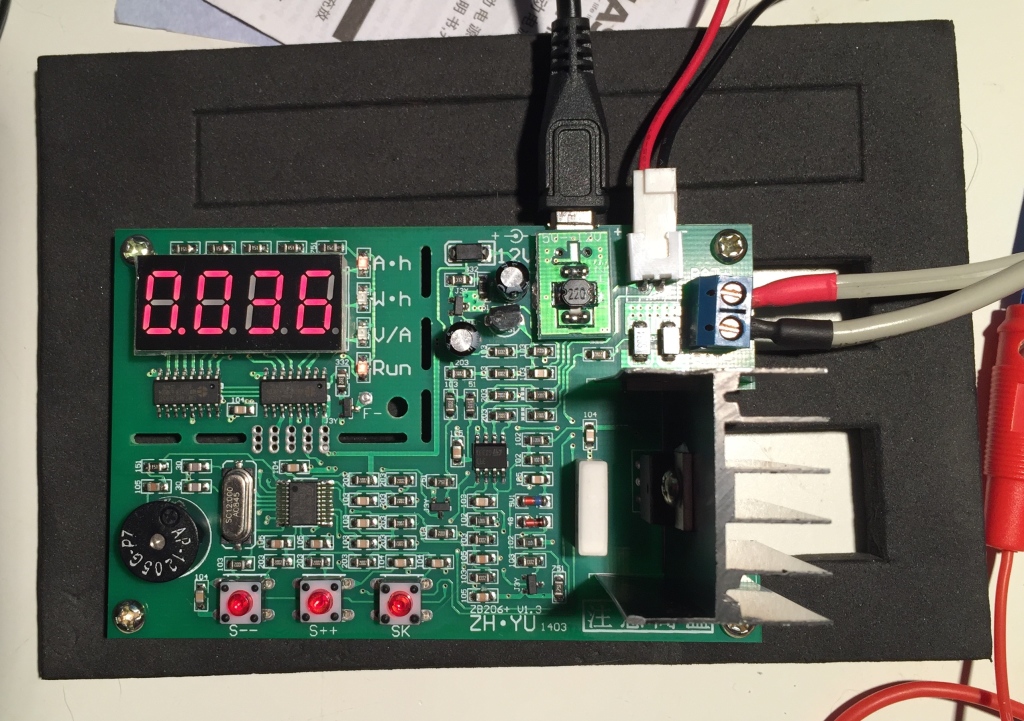
ElectroLabs has published a nicely documented programmable single/multi cell lithium battery charger shield for Arduino. It is based on the LT1510 Constant Current/Constant Voltage Battery charger IC.

Features include:

  • Display for battery/charge status and configuring charging parameters
  • 50mA 10 1.1A charging current.
  • 2-10V charge cut-off voltage

Those voltages don’t make a whole lot of sense for Lithium Ion, but it appears the charger IC they are using also works with other chemistries.

I don’t know the BOM cost, but an assembled version is $75 on Tindie (ouch).

I don’t think I’ll be building one of these, but I am very interested in having examples of using commercial charger ICs outside their default configurations.

[via Hack-a-Day]

Dell XX326 11.1V 60Wh Battery Pack Teardown

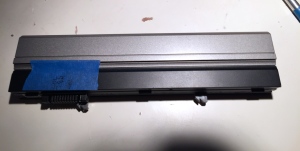
I picked up a lot of ten Dell XX326 6-cell 60Wh battery packs from an eBay seller for about $4.50/pack. The seller described them as untested surplus, and based on the presence of unworn external labels in the photos on the listing, I thought they might be unused packs and hoped I could turn around and sell them individually for a profit.

IMG_6762 IMG_6761

No such luck. The packs had more physical wear than I expected. When I hooked them up to PackProbe, I only got data out of two of them without hassle and the data they provided seemed to have problems, for example, reporting design capacity as 0. With a little work, I got one more to spill its secrets. A couple more would ACK a query at their address, but that was it, and the rest gave nothing at all.

I decided to tear apart a few of them. When I got one of them open and measured with a multimeter, I found all the cells were flat, 0V. The next one was a little better, but not great.IMG_6764

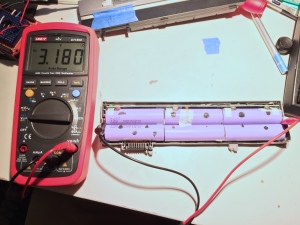
3.18V, for 3 banks in series. Not looking good. Lets see what the individual banks registered.

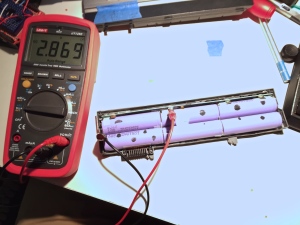
IMG_6765Hmm, one bank measures 2.86V. That’s not bad. The other two banks must be junk though, with a combined voltage of less than 0.4V.

IMG_6767

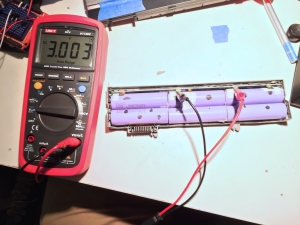
Wait a second, 3.0V that’s not bad, hmmm…

IMG_6769

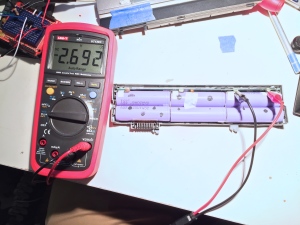
Yikes!!! One bank of cells has reversed polarity, in a really big way. I double checked my connections, but I still got the same result, -2.69V!

I tore into another 6 packs. One was nearly flat, with each bank just over 0v. The rest had at least one bank of cells at a reasonable voltage, with the remaining cells being low, flat, or slightly reversed.

It looks like all the packs are ~4-5 years old, and the packs I could get data out of each reported less than 40 cycles. I have to wonder what happened to these packs that they are in such crummy shape, or if the problem is with the pack design/engineering. There are also some manufacturing issues, I think two of the packs had welds break loose, without tearing the nickel conductor strips.

After pulling the individual cells out of three of the packs I’ve opened I’m even more baffled. All of them had at least one cell with failed spot welds. The first pack had all 0v cells, as expected. The second I thought would have two good cells, but it turned out only one cell in the bank was good. The other was flat. The third I thought had two good banks, but once the cells were separated, only one in each of those pairs was good. I think bad connections may have played some role in cell failures.

One theory: Cells paired with poorly connected cells failed because they were overused. I also wonder if some cells may have broken internal connections.

I’m holding off ripping apart the rest of the packs I’ve already opened, because I’m curious if I can get the battery management circuit to give up some data.


Notes from “Why do Li-ion Batteries Die” Lecture

Interesting video of a lecture by Dr. Jeff Dahn, professor of Physics and Chemistry at Dalhousie University in Canada on what causes lithium ion batteries to deteriorate, and how the situation can be improved. Dahn was involved in development of lithium ion battery technology, and maintains an large, active research program devoted to studying materials for batteries and fuel cells.

The video is over an hour long, and the pace is a little slow. I’ll be updating the post with my notes as I go through it.

Highlights

  • Manufacturer testing and rating of battery lifetime uses a simple cycle test that takes place under a compressed timeframe, with unfortunate results.
    • Charge/discharge cycles are done back-to-back, at charge/discharge rates that might not mirror real-world use.
    • This underrepresent the impact of the parasitic reactions during charge/discharge that lead to cell degradation.
  • During charge and discharge, lithium ions intercalate (intermingle) and de-intercalate with the the electrode material. This causes a modest, “benign” structural change of 3% in the anode and 10% in the cathode.
  • The materials used in lithium cell electrodes are stable in open air, and batteries can be assembled in open air.
    • As cells are charged, the material at both the cathode and anode become highly reactive with the electrolyte solution.
    • Fortunately, the reaction products are solid and form passivating surfaces that protect the electrodes from rapid degradation.
  • For a perfect Li-ion battery, the coulombic efficiency, the number of electrode in during charging vs the electrons out during discharge, should be exactly 1.
  • The difference between theoretical and actual coulombic efficiency, outside of the measurement area, is attributable to  undesirable parasitic reactions that lead to cell degradation.
  • With sufficient measurement precision, it is possible to predict lithium cell lifetime without intensive testing.
    • Requires at least 4 digits of precision and accuracy
  • Battery Electrolyte
    • Cyclic and linear organic carbonates
      • Ethylene Carbonate
      • Propylene Carbonate
      • Dimethyl Carbonate
      • Ethylmethyl Carbonate
    • Lithium Phosphorous Hexafluoride solute
    • Solvents are typically mixed
      • Some have low boiling points
      • Others form excellent passivating layers
  • Approximate 3-billion 18650 cells made a year
  • Parasitic reactions between electrodes and electrolytes reduce the capacity of the cell as lithium ions are consumed/trapped
    • Capacity change after first charge/discharge cycle is relatively large.
    • Loss in subsequent cycles is lower, because the reaction products form a passivating layer that protects the electrodes.
  • Extent of parasitic reactions can be quatified with a precise measure of coulombic efficiency.
    • A good cell is close to 100%.
    • 10,000 cycle life would require a cell with 99.99% efficiency
    • Need 4th digit in accuracy and precision.
  • Precision charging device
    • Developed by
      • Aaron Smith, PhD, graduated in 2012, now at Tesla in charge of Tesla’s Battery Lifetime Group
      • Chris Burns, PhD Student
    • Specs
      • 60 channels, each with precision current supplies with 5 digit precision
      • Cells under test are in temperature controlled boxes ( 0.05C)
      • Current is fed through precision resistors to measure current.
  • Longer charge cycles have higher coulombic inefficiency, and therefore more destructive parasitic reactions.
  • Coulombic Ineficiencies of common chemistries
    • Test conditions
      • Commercial 18650 cells, two per test condition
      • Charge / Discharge rates: C/24, C/50, C100
      • 30C, 40C, 50C, 60C
    • High-level
      • Coulombic inefficiency has linear relationship to charge time.
      • Strongly suggests that time under charge is the major factor in determining coulombic inefficiency for a given chemistry, at a given temperature.
    • Lithium Cobalt Oxide (LiC02)
      • Lowest parasitic reactions at 30°C
      • Moderate at 60°C, but still lower than Lithium Manganese Oxide at 30°C
      • Tesla has used chemistries with similar characteristics
    • Lithium Cobalt Manganese Oxide (Li[NiMnCo]02)
      • Moderate at 30°C
      • ~50% of Nissan Leaf and Chevy Volt packs
    • Lithium Iron Phosphate (LiFePO4)
      • Moderate parasitic reactions at 30°C, high at 60°C
      • Used by Fiskar
    • Lithium Manganese Oxide (LiMn02)
      • Highest parasitic reactions of all examples at 30°C and even worse at 60°C
      • ~50% Part of the Nissan Leaf and Chevy Volt battery pack
      • Ill-suited to use in battery packs without thermal management, like the Nissan Leaf.
  • Electrolyte additives
    • Vinylene Carbonate: reduces electrolyte oxidation on positive electrode. 2% by weight makes a huge difference
    • Trimethoxyboroxine, 1-3 propane sultone: impedence reducers.
    • Triethylphosphate and others: wetting agents to aid speed in manufacutre
    • Others for lifetime, low or high temp performance, and safety
    • Typical Li-ion cell will have 5 additives
  • Precision coulombic efficiency measurements allow impacts on cell lifetime to be assessed relatively quickly, traditional testing of discharge capacity vs cycle number requires testing to end-of-life.
    • Short term test results correlate with long term test results
  • Predicting catastrophic failures
    • Hypothesis
      • Reaction byproducts from cathode are migrating to anode, where they are reduced and gradually foul the material until the pores in the anode material are clogged. Once the pores are clogged, lithium starts plating out, and cell capacity plummets.
    • Predictions
      • The more compacted the anode material, the sooner the cells will fail.
        • This predicted behavior has been observed, and exploited to make cells that are designed to fail early in order to test other variables.
      • Coulombic Inefficiency * Cycles = A Constant
        • Coulombic Inefficiency = amount of byproducts
        • Constant is the amount of material required to clog the pores
        • A strong correlation has been observed for many additives
    • Exceptions
      • Some unknown additives from battery manufacturers have been tested and shown that make huge (20x) contributions to cycle life while falling outside the predictive model
      • Model assumes a solid reaction byproduct on negative
      • Additives may produce a reaction byproduct with different characteristics (ie liquid, gas)
    • Other observations
      • Coulombic efficiency and cycle life tend to increase with the number of additives
        • And yet most academic research on electrolyte additives only looks at one at a time.
  • New grant to put a 100 channel system on line with the capability of testing automotive scale cells
    • 10 ppm CE accuracy
  • Research Directions
    • Tests require highly uniform cells. Lab made cells can be rather inconsistent
    • Have established relationships with Chinese manufacturers of pouch cells
      • Get machine-made pouch cells without electrolyte in lots of 2,000
      • Mix and add electrolyte themselves.
      • Seal cells in vacuum sealer
    • Microcalorimeter
      • Measure the heat from parasitic reactions
      • TA Instruments TAM III
        • 12 separate calorimeters
        • 10nW sensitivity
        • Baseline stability of 500nW/month
        • Isothermal, all experiments at 40C
        • Holds AA and 200mAh cells.
      • Three sources of heat during charging (~1Wh cell capacity)
        • Entropy changes from electrodes
        • Internal resistance/polarization
        • Parasitic reactions
          • 100 uW would consume all the electrolyte in a year BAD
  • Questions from audience
    • Audience asked about the unknown additive outliers that didn’t conform to the simple model of reaction products clogging the pores on the anode.
      • Dahn replied that if those additives formed a liquid or gas reaction product, then one would expect the impedance to be lower. He then showed data showing that, indeed, the cells with outlier additives did have lower impedence.
    • Asked about using these techniques with silicon electrodes.
      • Silicon electrode cells at this point are so poor, that you can see the parasitic inefficiency with an ordinary charger.
      • Silicon electrodes need a lot of development before they need this precision.
      • Lithium Titanate
        • Incredibly durable already.
    • How can these metrics be applied to drive cycles?
      • GM wants to relate this to drive cycles.
        • Dahn’s initial approach is:
          • How does existing technology work for driving?
          • How does it look with precision charging?
          • What are the new technologies?
          • How do they perform under precision charging?
          • Based on result, he can say if the new stuff should be better or worse.
    • How do real-world discharge profiles relate to constant discharge rates seen in lab tests?
      • The biggest factor is time spent at highest voltage.
        • Longer is worse
        • Most of the parasitic reactions happen above 4v.
    • Lithium Ion Cell Overhang
      • Negative Electrode is slightly wider than the Positive
      • Prevents lithium ions from the positive electrode from plating out the edge of the negative and forming lithium metal dendrites
      • There is an overhang of graphite
      • At the beginning of charging there is some odd behavior as the ions equilibrate with the overhang
    • To extent the life of your phone or laptop battery
      • Keep it as cold as possible 🙂
      • Put it in the fridge.

Exploring Smart Battery Pack Data

Enthusiasts with a variety of interests, ranging from flashlights to electric vehicles, repurpose rechargeable lithium ion cells from laptop battery packs to power their projects. In order to assess the age and health of the cells, people use a succession of tests, ranging from quick tests of initial cell voltage, voltage ~12-24 hours after charging, and discharge tests on analyzing chargers. I looked at the initial cell voltage measurement in the context of information about pack age and history that hasn’t been available to most hobbyists.

To obtain this information, I used PackProbe. The PackProbe project allows quick access to the information contained in each pack’s “smart battery system,” using inexpensive, widely available hardware. PackProbe is part of a larger effort to improve the tools and information available to people re-using lithium ion cells.

 Materials and Methods

PackProbe was used to extract data from a lot of 34 used Lenovo ThinkPad 9-cell 84Wh battery packs (IBM-42T4619) obtained from a seller on the Budget Light Forums. I don’t know more about the provenance of these packs, other than that they apparently came from a single source in a few different shipments starting sometime this summer and totaling hundreds of packs.

Observations and Commentary

General

  • Most of the packs were manufactured on the 22nd and 23rd of October, 2009. Two on the 27th October, and three on the 8th of September.
  • The packs all report :
    • Manufactuer: SANYO06
    • Chemistry: LION
    • Design Capacity: 84.24 Wh
    • Design Voltage: 10.800 V
    • Charging Voltage: 12.600
    • Charging Current: 5000 mA

Cycle Count

The median charge/discharge cycle count is ~88, distributed as shown:

Unknown-2

Initial Cell Voltage

We used the self-reported pack voltage from each pack to estimate initial voltage of each cell. Some of the packs had their PCBs damaged in shipment, which made it difficult to get data out of them, but by applying ~6v to the pack, I was able to read out data. The reported voltages for the damaged packs were quite low, and from my investigation, it appears that they only report the series voltage for two of the banks of cells. If I take this into consideration, and look at the average cell voltage for all the packs, I see the following distribution:

Unknown-5

I suspect that all these packs were last charged at about the same time, likely just before their previous users gave up the machines in a round of upgrades (or layoffs). The variation in the voltages could be due to a number of factors, including variations in cell quality, pack wear, charger accuracy, storage conditions, and date of last charge.

Cell Voltage as a Proxy for Cell Wear

Exploring the idea the variations may be the result of pack wear, I’ve tried plotting cell voltage against the number of charge/discharge cycles for each pack:

Unknown-4

I don’t see an obvious relationship here. It seems like differences in self-discharge rate due to cell wear don’t explain the variations in voltages within the packs sampled, which all have cycle counts within the normal service life. It may be more useful for packs with large numbers of cycles (>300).

Smart Battery Capacity Measurement

SmartBattery packs maintain an estimate of pack capacity based on run-time data in order to account for aging of the pack. I wondered if initial cell voltage had a relationship to relationship to the pack management circuitry’s estimate of the packs remaining full-charge capacity:

Unknown-3

Again, I see no obvious relationship, perhaps not surprising, giving the broad distribution in the reported Full Charge Capacity (in Wh*10):

Unknown-6

Further, the reported full charge capacity doesn’t seem to have a strong relationship to cycle count:

Unknown

It is hard to know what to make of this, other than that there isn’t a clear relationship, which isn’t surprising, given that these packs haven’t been used for some time, and likely require a full charge/discharge/charge cycle before the full charge capacity estimates are accurate.

Discharge Test

I’ve only torn down one of these packs so far and tested the cells. Based on the tests, the full pack would have a capacity of 65 Wh, or 77% of the original capacity (at a relatively high 1C discharge rate). That’s not bad for less than $2.50, but its a pretty severe drop-off over the 103 cycles reported by the pack. It could be worse though, the reported full charge capacity was much lower, just 50Wh, or 60% of the original capacity.

Conclusions

This feels a little too much like writing up a lab report for a not-too-successful organic chemistry lab experiment back in college, lots of  trying to explain inconclusive observations. Even so, I think this work has important implications.

Foremost, the results are a strong indication that initial cell voltage from used packs is not a good indicator of cell wear for used packs, at least with packs of the age and cycle count distribution of our sample.

Second, it should be clear that PackProbe provides useful information for assessing the value of a pack without necessitating tearing the pack apart.

Future Work

I intend to do more work to improve PackProbe and use it to better characterize used and aged lithium ion batteries. I hope others will join in the effort. Opportunities for community contribution include:

Join the Power Cartel forum to contribute and stay abreast of PackProbe development.
An Interview with Tesla Battery Hacker [wk057]

Hack a day has an Interview with the guy who got a battery pack from a wrecked Tesla Model S.

One interesting take-away he paid about $20K for it. I think those packs have 6-7000 cells, so that works out to about $3 per 18650 cell.

That’s not bad on a per-cell basis. New old-stock laptop packs with similar capacity cells seem to go for $3-5/cell, though I’ve scored a few for ~$2.25/cell.

Since he was able to use the packs more or less intact, though, $3/cell is a great deal, considering all the labor he saved disassembling packs and then building a large pack for his project.

Dell and Thinkpad Lithium Ion Pack Irritation

I got a bunch of Thinkpad Lithium Ion battery packs yesterday and dumped pack data out of all of them. The new packs had the same issue I saw with a pack for a different module, they don’t report individual cell voltages in response to commands that work with many other packs.

I did some research and found that the linux tm-smapi module provides access to individual cell voltages but from a little reading, it looks like this information may come by way of an embedded system controller. I figured there was still a good chance that this information was originally gathered from the battery via SMBus, so I wrote a simple arduino sketch to scan through a wide range of SMBus commands and look at the data returned. Unfortunately, I don’t see any values that look like cell voltages.

With any luck, the data is still there, and just packed in a way that isn’t obvious. I think I’m going to need to collect data from multiple packs to see which values differ, particularly if I charge or discharge the packs. The worst possible option is that reading the data requires putting the pack in an undocumented mode and using undocumented commands.

The Dell packs I have don’t yield individual cell voltages either, so while I was at it, I also looked to see if any of the Dell packs might report the data in response to non-standard commands. Again, nothing obvious. I couldn’t find any confimation on line that Dell makes this info available via any utilities, so I may be chasing something that isn’t there.

The humble Smart Battery reveals its secrets

It took me a little longer than I’d hoped, but I’m able to get most of the information I want out of most of the laptop batteries I’ve tested.

ASUS AL32-1005

Manufacturer Name: AS085NJ35E
Device Name: 1005-28
Chemistry LGC0
Design Capacity (mAh): 5400
Design Voltage: 11250
Manufacture Date (Y-M-D): 2009-6-21
Serial Number: 937
Specification Info: 49
Cycle Count: 254
Voltage: 10.28
Full Charge Capacity (mAh): 1680
Remaining Capacity (mAh): 0
Relative Charge PCT: 0
Absolute Charge: 0
Minutes remaining for full charge: -1
Cell 1 Voltage: 2642
Cell 2 Voltage: 3820
Cell 3 Voltage: 3817
Cell 4 Voltage: 0
State of Health: 0
Charging Current: 0
Charging Voltage: 0
Temp: 20.25
Current (mA): 0

You’ll see that this pack is 5 years old, and has had 254 cycles, which probably puts it near the end of its useful life. Looking at the individual cell voltages (actually banks of parallel cells), you’ll see that that one of them is quite a bit lower than the others, suggesting those cells are closer to failing.
I’m still having trouble with the Dell packs I’ve tested. I can get most of the information I want from them, but they don’t report the capacity of the individual cells properly. The individual cell data isn’t part of the official smart battery standard, but it seems pretty standardized. It may be the Dell packs don’t report that information at all, or it may be that they use a different set of commands to reveal it.

Dell 9T48V

Dell 9T48V
Manufacturer Name: SMP-SDI2.8
Device Name: DELL YXVK234J
Chemistry LION
Design Capacity (mAh): 8400
Design Voltage: 11100
Manufacture Date (Y-M-D): 2013-4-19
Serial Number: 181
Specification Info: 49
Cycle Count: 44
Voltage: 10.03
Full Charge Capacity (mAh): 8428
Remaining Capacity (mAh): 0
Relative Charge PCT: 0
Absolute Charge: 0
Minutes remaining for full charge: -1
Cell 1 Voltage: -1
Cell 2 Voltage: -1
Cell 3 Voltage: -1
Cell 4 Voltage: -1
State of Health: -1
Charging Current: 4214
Charging Voltage: 12900
Temp: 23.25
Current (mA): 0

HP Packs have been a mixed bag. I’ve been able to get a full compliment of data out of some of them, and none at all out of others. I’ll work on fixing it after the initial release.

The code runs on an arduino Yun now, and should be easily adapted to any arduino compatible. I’m going to write a little documentation and release it while I continue to work on it.  If you are interested in getting early access, leave a comment here.

Inateck 120cm USB to Micro USB / Lightning Cable

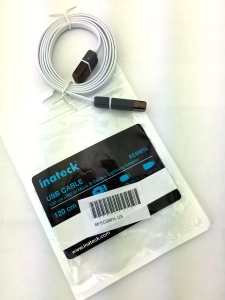
I recently purchased an Inateck (EC2001L) 120cm USB to Micro B cable that comes with a Lightning adapter for recent Apple iOS devices from Amazon. I picked the cable for its dual-purpose nature, but it is also set apart by its flat profile, which reduces tangles. IMG_6634 My plan was to keep it in my bag with a USB powerbank so that I could use the cable to charge the powerbank and iOS devices.

Unfortunately, it isn’t up to the task. First thing I realized is that I missed the fact that it wasn’t Apple MeFi certified. In the past I’ve had trouble with non-MeFi lightning cables leading to slowed charging rates.

The Inateck cable seems to have the same problem. At first I thought it wasn’t allowing the iOS device to properly determine the current delivery capability of the power source, but when I moved the lightning adapter to another Micro B cable, it worked fine, so, the problem must be the resistance of the cable itself.

I did some tests using a multimeter and some USB testing equipment and I found that the cable does, indeed, have high resistance 370 miliOhms or more, leading to a voltage drop of 0.37v at the 1A charging currents used my iPhones, and even more at the 1.5-2A demanded by an iPad. Other cables had less than half the resistance, and correspondingly, less than half the voltage drop.

This cable is fine for data transfer and occasional charging, but it isn’t what you want to use for charging if time or power are precious, because it will take longer than a lower resistance cable.